When an internationally recognized music festival is in need of a complete overhaul of their digital presence
Background
Sandbox is an annual 3-day electronic music festival on the shores of the Red
Sea at El Gouna established in 2013.
The client’s objectives were to:
- Increase early sell out- in order to be more selective and avoid on-door selling.
- Expand foreign sales.
- Incentivize sales during early bird tier.
Duration of project: 4 months.


The Challenge
- Sandbox was operating through two domains: one website for festival info and another for booking. This made all tracking efforts very challenging.
- Sandbox’s main website was in poor shape in terms of broken links, optimization & SEO ranking.
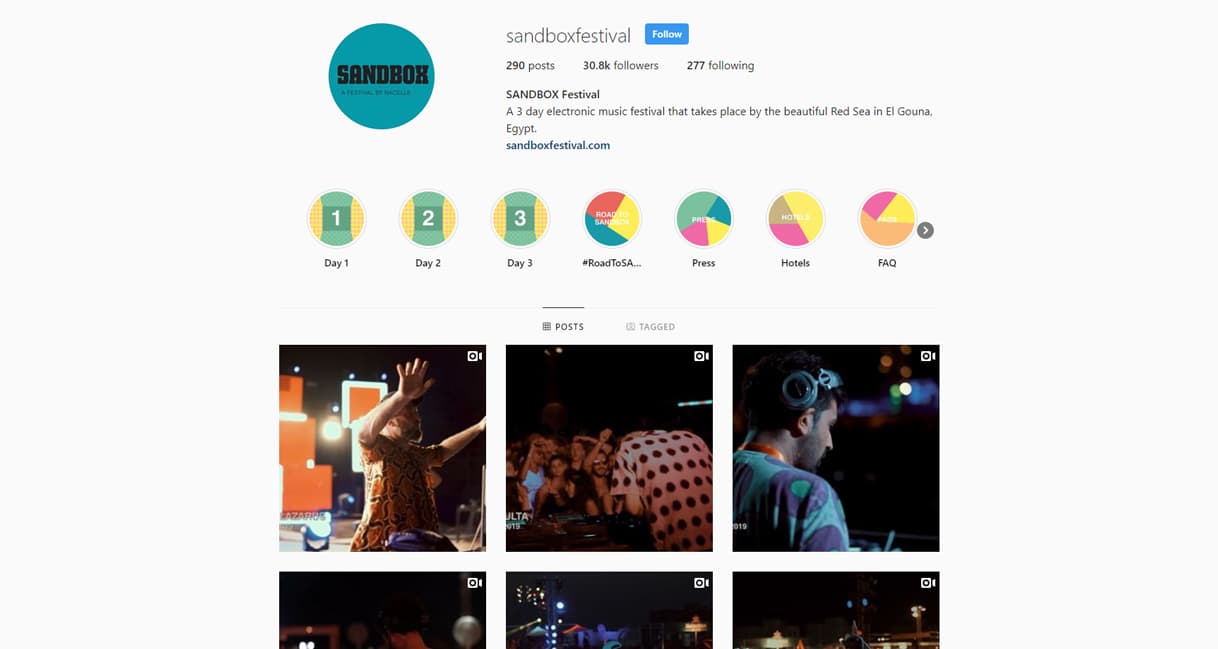
- A lack of proper digital structure on social media platforms –this presents difficulty for users to find all the main information about Sandbox through the pages.


The Solution
A complete, detailed website audit was performed for Sandbox. After extensive research, analysis and consultation with the client, ripplemark then proposed a complete digital marketing strategy that best serves the client’s objectives and offers solutions and work arounds for the issue of the 2 domains.
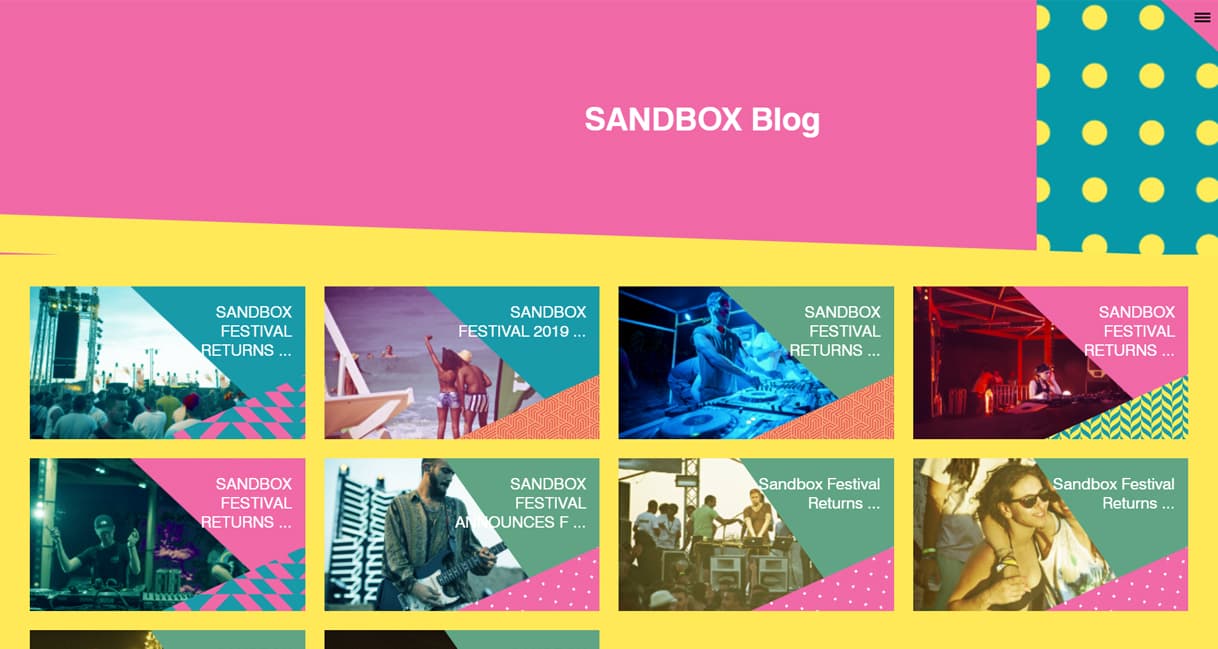
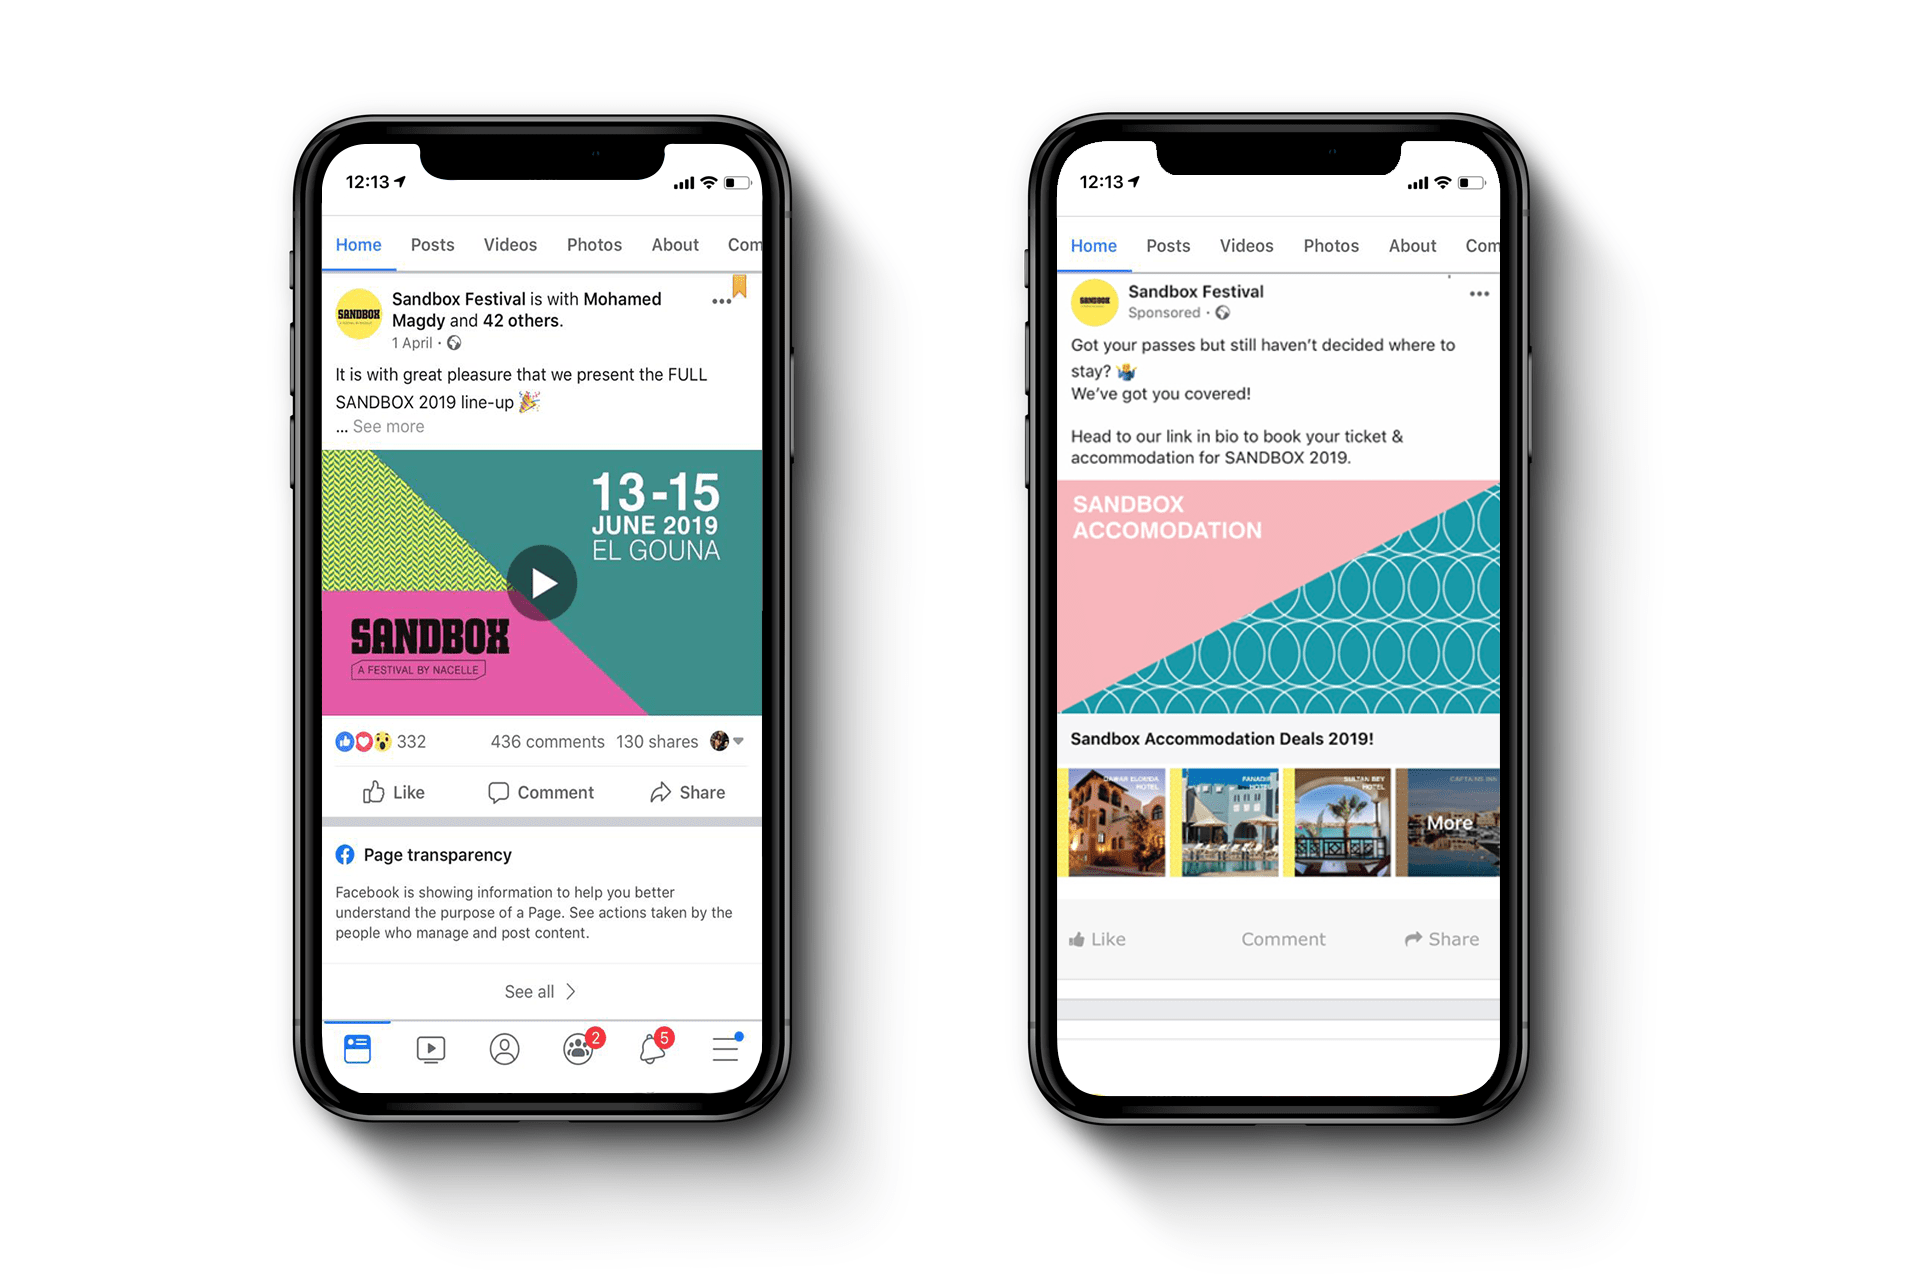
Included in the strategy was the proposal of creating a blog section on the Sandbox website in order to increase the website’s SEO score through hosted & original long form content. After reporting the website audit, ripplemark also heavily worked on optimizing all aspects of Sandbox’s main website. ripplemark’s paid advertising team also worked arduously in order to acquire qualified foreign leads according to the target countries; digital advertising efforts were also lead by a strong content strategy tailored and adjusted according to the target audience’s response.


The Outcome
Digital Marketing
- Average website position 34.9 to 7.
- Average CTR 1.5% to 13.3%.
- Total Clicks 3.93 to 16.6K.
Ecommerce Management
- ROAS 10.4 in foreign ticket sales.
Organic Social Metrics for Event Coverage(13-15 June)
- Follower evolution 19.2K to 27K.
- Average story views 10,000 to 14,000.
- Average IG video views 5,000 to 7,000.
- Average FB reach 3,000 to 6,000.


